AIOps with Splunk and Event-Driven Ansible - Solution Guide

Overview
Operations teams spend their days reacting – triaging alerts, investigating dashboards, and manually remediating issues that have already impacted users. When a critical service degrades at 3 AM, the response starts with a page, continues with an investigation, and ends with a fix applied long after customers have noticed. This reactive model cannot scale as infrastructure complexity grows and the cost of downtime increases.
This guide demonstrates how to connect Splunk to Event-Driven Ansible (EDA) to build closed-loop AIOps pipelines that detect, enrich, and remediate infrastructure issues automatically. It covers three use cases that demonstrate the pattern across different Splunk products and infrastructure domains:
- Use Case A: Predictive AIOps with Splunk ITSI – ML-driven anomaly prediction using Kalman Filter forecasting, with automated remediation via the Red Hat EDA Add-on for Splunk
- Use Case B: RHEL Server Remediation – Splunk webhook alerts trigger AI-enriched diagnostics and automated service recovery on RHEL hosts
- Use Case C: Network AIOps (OSPF) – Splunk detects Cisco OSPF neighbor failures, AI diagnoses the root cause, and Ansible Lightspeed generates remediation playbooks
This guide builds on the AIOps reference architecture.
For the full end-to-end AIOps pipeline – including AI inference, Lightspeed playbook generation, and the Crawl/Walk/Run maturity model – see AIOps automation with Ansible. This guide focuses specifically on using Splunk as the observability and detection layer with Event-Driven Ansible as the automation bridge.
- Overview
- Background
- Solution
- Prerequisites
- Use Case A: Predictive AIOps with Splunk ITSI
- Splunk Webhook Alert Pipeline
- Use Case B: RHEL Server Remediation
- Use Case C: Network AIOps – OSPF Remediation
- Validation
- Maturity Path
- Related Guides
- Summary
Background
Splunk is a data platform that collects, indexes, and correlates machine-generated data – logs, metrics, traces, and events – from virtually any source across an organization’s IT environment. Its search processing language (SPL) lets teams build saved searches and alerts that fire when conditions match predefined thresholds or patterns.
![]() Splunk Enterprise – splunk.com
Splunk Enterprise – splunk.com
Splunk IT Service Intelligence (ITSI) extends Splunk Enterprise with service-centric monitoring. Unlike infrastructure monitoring tools that track individual hosts and metrics in isolation, ITSI organizes monitoring around business services and computes a real-time service health score from underlying KPIs weighted by importance. This means operations teams can see the impact of a technical anomaly on a business outcome before the business team reports it.
![]() Splunk ITSI Documentation – docs.splunk.com
Splunk ITSI Documentation – docs.splunk.com
The Machine Learning Toolkit (MLTK) extends Splunk with ML algorithms accessible directly from SPL. The predict command runs time-series forecasting models – including the Kalman Filter (LLP5) – as part of a scheduled search pipeline. The Kalman Filter builds a statistical model of “normal” behavior and projects values into the future with confidence intervals. When actual values exceed the model’s upper confidence bound (forecast outlier) or the model’s future projection exceeds a critical threshold (forecast breach), the system flags an anomaly – often before static thresholds would fire.
This is the core difference between reactive and predictive operations:
| Approach | When It Fires | AI/ML Depth |
|---|---|---|
| Static threshold alerting | When a metric has already crossed a fixed boundary | None – simple comparison |
| Adaptive thresholds (ML-assisted) | When a metric crosses a dynamically calculated boundary | Medium – standard deviation algorithm recalculates nightly |
| MLTK forecast + outlier detection | When the model predicts a metric will cross a boundary, or when actual values deviate from the model’s expectation | High – Kalman Filter forecasting with confidence intervals |
In traditional operations, a Splunk alert fires and creates a ticket or sends an email. A human then investigates, determines root cause, and manually remediates. Event-Driven Ansible eliminates this bottleneck by consuming Splunk alerts programmatically and triggering automation workflows in real time. This applies equally to server infrastructure (service outages, resource exhaustion, configuration drift) and network infrastructure (OSPF adjacency failures, interface errors, routing misconfigurations).
The combination of Splunk’s detection capabilities with Ansible’s remediation capabilities creates a closed-loop operations model: Splunk detects, EDA responds, AI enriches, and Ansible fixes.
Solution
What makes up the solution?
 Splunk Enterprise or Splunk Cloud for centralized log ingestion, alerting, and correlation [Link]
- Splunk ITSI for service-centric monitoring, KPI tracking, business service health scoring, and episode management (Use Case A) [Link]
 Splunk Machine Learning Toolkit (MLTK) for Kalman Filter forecasting, outlier detection, and predictive anomaly correlation (Use Case A) [Link]
 Red Hat Event-Driven Ansible Add-on for Splunk to bridge ITSI episodes to Event-Driven Ansible via webhook (Use Case A) [Link]
 Event-Driven Ansible (EDA) to receive Splunk alerts and ITSI episode events, triggering automation based on rulebook conditions [Link]
- Red Hat AI for AI-driven root cause analysis of alert context (Use Cases B, C) [Link]
 Ansible Automation Platform (AAP) for orchestrating enrichment and remediation workflows [Link]
 Ansible Lightspeed to generate remediation playbooks from AI-enriched context (Use Case C) [Link]
EDA is part of Ansible Automation Platform.
EDA uses rulebooks to monitor events, then executes specified job templates or workflows based on the event. Think of it simply as inputs and outputs. EDA is an automatic way for inputs into Ansible Automation Platform, where Ansible Automation Platform is the output (running a job template or workflow).
Who Benefits
| Persona | Challenge | What They Gain |
|---|---|---|
| Spending nights responding to threshold alerts that already impacted customers – reactive firefighting with no prediction | ML-driven anomaly detection identifies degradation before thresholds breach; Splunk alerts automatically trigger enrichment and remediation workflows | |
| Manually troubleshooting OSPF adjacency failures across dozens of routers – checking interface states, network types, and timers one device at a time | AI-driven diagnostics identify root cause automatically; Lightspeed generates targeted remediation playbooks with check-mode validation before execution | |
| Connecting Splunk to Ansible requires custom scripting, webhook plumbing, and fragile integrations | A reference architecture with the official Red Hat EDA Add-on for Splunk, production-ready EDA rulebooks, Splunk webhook configs, and tested collection usage – applicable across ITSI, server, and network domains | |
| Alert fatigue and growing MTTR despite investment in both Splunk and Ansible | Closed-loop automation that turns Splunk from a detection tool into a detection-and-resolution tool – with measurable MTTR reduction and full audit trail |
Recommended Demos and Self-Paced Labs:
 Hands-On AIOps Workshop – Part 2: Network Automation with Splunk covers Splunk integration with Cisco router remediation end-to-end
Source Code:
 ansible-tmm/aiops-splunk-eda – EDA rulebook and remediation playbook for the Splunk ITSI predictive AIOps pipeline (Use Case A)
- ansible-tmm/aiops-summitlab – Rulebooks, playbooks, and workflow definitions for the network AIOps use case (Use Case C)
Prerequisites
Ansible Automation Platform
- Ansible Automation Platform 2.5+ – Required for enterprise Event-Driven Ansible support with external event streams and webhook sources.
Featured Ansible Content Collections
| Collection | Type | Purpose |
|---|---|---|
| ansible.eda | Certified | EDA event sources – provides the ansible.eda.webhook source plugin for receiving Splunk alerts and ITSI episode payloads |
| splunk.itsi | Certified | ITSI episode management – query episodes, add comments, update status, and close incidents programmatically (Use Case A) |
| splunk.es | Certified | Manage Splunk Enterprise Security resources – correlation searches, adaptive response actions, and data inputs |
| redhat.ai | Certified | AI model inference using the OpenAI-compatible API via InstructLab (Use Cases B, C) |
| ansible.controller | Certified | AAP configuration as code – job templates, workflows, surveys |
| ansible.scm | Certified | Git operations – commit and push generated playbooks (Use Case C) |
| cisco.ios | Certified | Cisco IOS device management – required for the network AIOps use case (Use Case C) |
| servicenow.itsm | Certified | ServiceNow ITSM incident creation and enrichment |
Splunk Stack
| Component | Version | Used By | Purpose |
|---|---|---|---|
| Splunk Enterprise | 9.1+ | All | Core data platform |
| Splunk ITSI | 4.21+ | Use Case A | Service-centric monitoring, KPI tracking, episode management, Rules Engine |
| Machine Learning Toolkit (MLTK) | Latest | Use Case A | Kalman Filter (LLP5) forecasting via the predict SPL command |
| Python for Scientific Computing | Latest | Use Case A | MLTK dependency – provides NumPy, SciPy, and other ML libraries |
| Red Hat Event-Driven Ansible Add-on for Splunk | 1.0.1+ | Use Case A | Exposes the Ansible Episode Action (ITSI) for forwarding episodes to EDA |
External Systems
| System | Required For | Notes |
|---|---|---|
| AI inference endpoint | Use Cases B, C | Red Hat AI (RHEL AI + InstructLab) or any OpenAI-compatible API |
| Ansible Lightspeed | Use Case C | For dynamic playbook generation at the Run maturity level |
| Git repository | Use Case C | GitHub, GitLab, or Gitea for storing generated playbooks |
| Chat or ITSM tool | Recommended | Slack, Mattermost, or ServiceNow for human-in-the-loop notifications |
| Cisco routers with OSPF | Use Case C | Two or more Cisco IOS/IOS-XE devices with OSPF configured |
Use Case A: Predictive AIOps with Splunk ITSI
This use case demonstrates the most advanced integration pattern – ML-driven predictive detection using ITSI’s Kalman Filter forecast model with automated remediation via the Red Hat Event-Driven Ansible Add-on for Splunk. Rather than waiting for static thresholds to breach, the system predicts service degradation and triggers remediation before users feel the impact.
The Scenario
A large retail organization runs its e-commerce platform on a service hierarchy monitored by Splunk ITSI. At the top level, business stakeholders track the Retail Revenue KPI. Underneath, ITSI tracks the technical services that keep revenue flowing – including the On-Prem DB service, which handles transaction processing for the retail application.
One of the On-Prem DB service’s critical KPIs is Network Throughput – Bytes In, which normally operates in the ~553K–665K byte range. When throughput spikes beyond normal bounds – whether from a sudden traffic surge, a misconfigured load balancer, or a network capacity bottleneck – the downstream effects cascade: database connection pools saturate, transaction latency increases, queries start timing out, and the retail application degrades for end users.
The On-Prem DB KPI has its importance set to 11 (maximum) – making it a minimum health indicator. When this KPI goes Critical, the entire service health score is forced to Critical regardless of other KPIs. This connects the technical anomaly directly to business service impact.
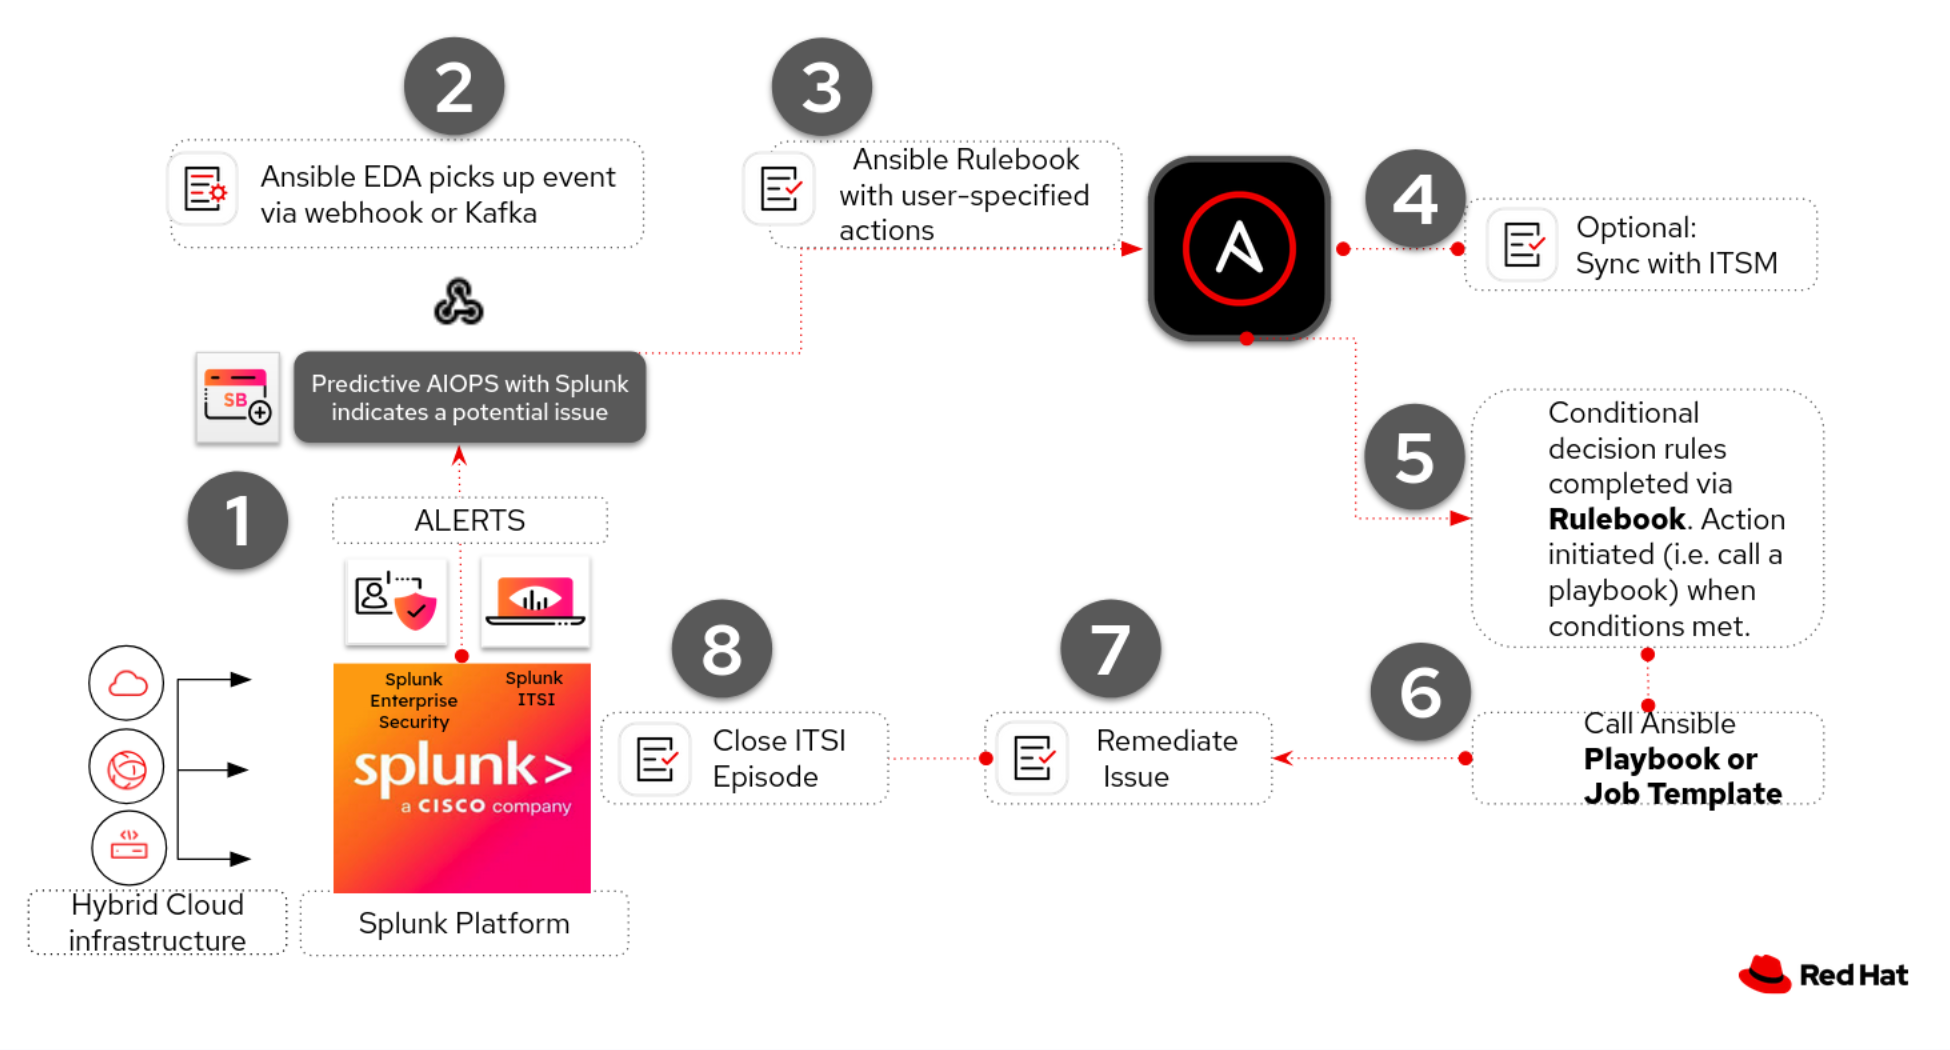
Instead of waiting for a static threshold to breach and paging an on-call engineer, the system:
- Predicts the throughput spike using a Kalman Filter forecast model
- Creates an episode with rich context: the impacted service, KPI, predicted values, and affected entities
- Triggers automated remediation via Event-Driven Ansible
- Closes the incident with a documented audit trail, before any customer reports an issue
Architecture Diagram
A1. Predictive Detection with MLTK
Operational Impact: None – read-only analysis of KPI data that generates notable events when anomalies are detected.
The correlation search uses three detection methods in a hybrid approach:
| Method | Mechanism | When It Fires |
|---|---|---|
| Primary: Forecast Breach | predict command projects future values; fires when prediction > 800,000 |
Predicts anomaly before it fully manifests |
| Secondary: Forecast Outlier | Actual KPI value exceeds the 85% confidence upper bound | Detects anomaly in current data |
| Tertiary: Threshold Fallback | Actual KPI value exceeds 750,000 (static check) | Guarantees detection even if the Kalman Filter adapts |
Why a hybrid approach?
The Kalman Filter is adaptive – after sustained high values, it widens its confidence interval, which can cause outlier detection to stop firing. The static threshold fallback guarantees detection when the KPI is Critical.
Search Properties:
| Setting | Value |
|---|---|
| Search Name | MLTK Forecast Anomaly - Network Throughput |
| Schedule | Every 5 minutes (production) or every 1 minute (faster detection) |
| Time Range | Last 4 hours |
| Notable Severity | Critical (6) |
Correlation Search SPL:
index="itsi_summary"
  indexed_itsi_service_id::<your-service-id>
  kpi="Network Throughput - Bytes In" is_service_max_severity_event=1
  earliest=-4h latest=now
| table _time, kpi, alert_value
| stats max(alert_value) as alert_value by _time, kpi
| xyseries _time kpi alert_value
| predict "Network Throughput - Bytes In" as prediction algorithm=LLP5
    holdback=5 future_timespan=30 upper85=upper85 lower85=lower85
| eval actual='Network Throughput - Bytes In'
| eval is_outlier=if(isnotnull(actual) AND actual > upper85, 1, 0)
| eval is_forecast_breach=if(isnull(actual) AND prediction > 800000, 1, 0)
| eval is_threshold_breach=if(isnotnull(actual) AND actual > 750000, 1, 0)
| stats sum(is_outlier) as outlier_count,
        sum(is_forecast_breach) as forecast_breach_count,
        sum(is_threshold_breach) as threshold_breach_count,
        max(prediction) as max_prediction, max(actual) as max_actual
| where outlier_count > 0 OR forecast_breach_count > 0 OR threshold_breach_count > 0
| eval title = case(
    forecast_breach_count > 0,
      "MLTK Alert: Network Throughput predicted to reach "
        .round(max_prediction,0)." (threshold: 800,000)",
    outlier_count > 0,
      "MLTK Alert: ".outlier_count
        ." forecast outlier(s) detected — actual exceeds upper 85% confidence",
    threshold_breach_count > 0,
      "MLTK Alert: Network Throughput at ".round(max_actual,0)
        ." exceeds critical threshold 750,000",
    1=1, "MLTK Anomaly Detected")
| eval description = "Network Throughput anomaly: Kalman Filter forecast detected
    breach or outlier on On-Prem DB service"
| eval itsi_service_id = "<your-service-id>"
| eval itsi_kpi_id = "<your-kpi-id>"
ITSI sets the
sourcefield automatically.ITSI overrides any
eval sourcein the SPL with the correlation search name. The aggregation policy source filter must match this name exactly.
A2. Aggregation Policy and Episode Management
Operational Impact: None – configures how notable events are grouped into actionable episodes.
| Setting | Value |
|---|---|
| Policy Name | Network Throughput Anomaly |
| Filter 1 | severity matches Critical |
| Filter 2 | source matches MLTK Forecast Anomaly - Network Throughput |
| Split by | source |
| Break episode | If no events are received for 30 minutes |
| Action Rule | “the following event occurs” with severity = Critical -> Ansible Episode Action (ITSI) |
Use “the following event occurs” – not “the episode severity is”.
The “episode severity is” trigger only fires on severity transitions. Since the episode is born Critical, there is no transition and the rule never fires.
Enabling the Episode Action:
Before Ansible Episode Action (ITSI) appears in the Action Rules dropdown, register it in ITSI:
# $SPLUNK_HOME/etc/apps/SA-ITOA/local/notable_event_actions.conf
[ansible_itsi]
disabled = 0
Restart Splunk after adding this stanza.
A3. Event-Driven Ansible Integration
Operational Impact: None – Event-Driven Ansible receives the webhook and evaluates rulebook conditions.
EDA Rulebook:
- name: Network AIOPS
  hosts: localhost
  sources:
    - ansible.eda.webhook:
        host: 0.0.0.0
        port: 5000
  rules:
    - name: Network Load issue Detected
      condition: >-
        event.payload.sourcetype is defined
        and event.payload.sourcetype == "itsi_notable:group"
        and event.payload.itsi_policy_id is defined
        and event.payload.itsi_policy_id == "<your-aggregation-policy-id>"
      throttle:
        group_by_attributes:
          - event.payload.itsi_group_id
        once_within: 15 minutes
      action:
        run_job_template:
          name: Network loadbalance
          organization: Default
          post_events: true

    - name: Catch all webhook events for debugging
      condition: event.payload is defined
      action:
        debug:
          msg: "Event keys: {{ event.payload.keys() | list }}"
The rulebook matches on sourcetype == "itsi_notable:group" and the specific itsi_policy_id, then launches the Network loadbalance job template. The throttle prevents automation storms by allowing only one trigger per episode within 15 minutes. Because EDA uses post_events: true, the full ITSI episode payload is available to the playbook via ansible_eda.event.payload.
A4. Automated Remediation
Operational Impact: High – modifies infrastructure configuration and closes ITSI episodes.
The playbook follows a four-phase pattern: fix -> wait -> document -> close.
Remediation Playbook (remediate_network_throughput.yml):
---
- name: AIOps - Remediate Network Throughput Anomaly
  hosts: itsi
  gather_facts: false

  vars:
    splunk_base_url: "https://{{ ansible_host }}:{{ ansible_httpapi_port }}"
    episode_id: "{{ ansible_eda.event.payload.itsi_group_id }}"
    normalization_wait_minutes: 10

  tasks:
    # ── Phase 1: Apply remediation ──
    ... <See examples below>

    # ── Phase 2: Wait for KPI normalization ──
    - name: Wait for infrastructure to stabilize
      ansible.builtin.pause:
        minutes: "{{ normalization_wait_minutes }}"

    # ── Phase 3: Document the remediation ──
    - name: Add remediation comment to episode
      splunk.itsi.itsi_add_episode_comments:
        episode_key: "{{ episode_id }}"
        comment: "Auto-remediated by Ansible - Network infrastructure scaled"

    # ── Phase 4: Close the incident ──
    - name: Close episode - mark resolved
      splunk.itsi.itsi_update_episode_details:
        episode_id: "{{ episode_id }}"
        status: "5"
        severity: "2"
        owner: "admin"
        instruction: "Auto-remediated by Ansible - Network infrastructure scaled"
The episode_id variable (ansible_eda.event.payload.itsi_group_id) targets the exact episode from the EDA event – no need to query or filter episodes at runtime.
Adapting the remediation to your environment.
The reference implementation uses Phase 1 to interact with the Splunk REST API. In production, Phase 1 would be a real infrastructure change. Below are three examples of what that could look like depending on your environment. The four-phase pattern (fix, wait, document, close) stays the same regardless.
Example: Increase bandwidth on a Cisco router interface
If the root cause is a bandwidth constraint on the database network path, the playbook can push a configuration change directly to the router:
    - name: Increase interface bandwidth to relieve throughput bottleneck
      cisco.ios.ios_config:
        lines:
          - bandwidth 10000
          - no shutdown
        parents: interface GigabitEthernet0/1
      delegate_to: "{{ db_gateway_router }}"

    - name: Verify interface is operational
      cisco.ios.ios_command:
        commands:
          - show interface GigabitEthernet0/1 | include BW|line protocol
      delegate_to: "{{ db_gateway_router }}"
      register: interface_check
Example: Scale an F5 load balancer pool
If the throughput spike is caused by uneven traffic distribution, the playbook can add a member to the load balancer pool:
    - name: Add standby server to database load balancer pool
      f5networks.f5_modules.bigip_pool_member:
        provider: "{{ f5_provider }}"
        pool: db_backend_pool
        host: "{{ standby_db_host }}"
        port: 5432
        state: present
        ratio: 1

    - name: Verify pool member is healthy
      f5networks.f5_modules.bigip_pool_member:
        provider: "{{ f5_provider }}"
        pool: db_backend_pool
        host: "{{ standby_db_host }}"
        port: 5432
        state: present
      register: pool_status
Example: Scale network bandwidth in AWS
If the database service runs in AWS and the bottleneck is a VPC network limit, the playbook can modify the instance’s network configuration:
    - name: Upgrade instance to higher network bandwidth tier
      amazon.aws.ec2_instance:
        instance_ids:
          - "{{ db_instance_id }}"
        instance_type: "m5.2xlarge"
        state: running
        wait: true

    - name: Update VPC security group to allow higher throughput
      amazon.aws.ec2_security_group:
        name: db-tier-sg
        vpc_id: "{{ vpc_id }}"
        rules:
          - proto: tcp
            from_port: 5432
            to_port: 5432
            cidr_ip: "{{ app_subnet_cidr }}"
        state: present
Splunk Webhook Alert Pipeline
Use Cases B and C below use Splunk webhook alerts (rather than the ITSI Red Hat EDA Add-on) to trigger Event-Driven Ansible. The workflow has four stages, matching the AIOps reference architecture:
- Splunk Alert -> EDA – A saved search or alert fires and sends a webhook payload to Event-Driven Ansible
- Enrichment Workflow – AAP gathers additional context, sends it to Red Hat AI for root cause analysis, and notifies the operations team
- Remediation Workflow – Ansible Lightspeed generates a remediation playbook, commits it to Git, and creates a Job Template
- Execute Remediation – The generated playbook runs against the affected infrastructure
| Stage | Operational Impact | Why |
|---|---|---|
| 1. Splunk Alert -> EDA | None | Read-only – Splunk fires a webhook, EDA receives it |
| 2. Enrichment Workflow | Low | Collects logs/diagnostics, calls an AI API, posts to chat/ITSM |
| 3. Remediation Workflow | Low | Generates a playbook, commits to Git. Prepares the fix but does not touch production |
| 4. Execute Remediation | High | Modifies production infrastructure. Should go through a change window or approval gate |
Splunk Alert -> Webhook -> EDA Rulebook -> Enrichment Workflow -> AI Analysis -> Remediation Workflow -> Execute Fix
Splunk replaces the Kafka/Filebeat layer.
In the AIOps reference architecture, Filebeat and Kafka handle event collection and transport. When using Splunk, it handles both – Splunk ingests the data and fires the alert directly to EDA via webhook, simplifying the architecture.
Use Case B: RHEL Server Remediation
This use case demonstrates the Splunk-to-EDA pipeline for detecting and remediating RHEL server issues – such as a failed httpd service.
B1. Configure Splunk Alert Action (Webhook)
Operational Impact: None
Splunk alerts can trigger a webhook action that sends an HTTP POST to any endpoint – including the Event-Driven Ansible webhook receiver. In Splunk, navigate to Settings -> Searches, reports, and alerts and edit (or create) a saved search. Under Trigger Actions, add a webhook action pointing to your EDA endpoint:
| Field | Value |
|---|---|
| Trigger condition | Number of results is greater than 0 |
| Trigger action | Webhook |
| URL | https://<eda-controller-host>:5000/endpoint |
The webhook payload Splunk sends includes the search name, results count, and a link to the results:
{
  "sid": "scheduler_admin_search_RMD567890",
  "search_name": "High CPU Alert - web servers",
  "app": "search",
  "owner": "admin",
  "results_link": "https://<splunk-host>/app/search/@go?sid=scheduler_admin_search_RMD567890",
  "result": {
    "host": "web01.prod.internal",
    "sourcetype": "cpu_metrics",
    "cpu_percent": "98.5",
    "_raw": "2025-02-18 14:32:01 host=web01 cpu_percent=98.5 process=java pid=12345"
  }
}
Splunk Enterprise Security customers.
If you use Splunk Enterprise Security (ES), you can use Adaptive Response Actions instead of basic webhook alerts. The
splunk.esAnsible collection can also manage correlation searches and notable events programmatically.
B2. EDA Rulebook for Splunk Events
Operational Impact: None
---
- name: Splunk alert response
  hosts: all
  sources:
    - ansible.eda.webhook:
        host: 0.0.0.0
        port: 5000

  rules:
    - name: Splunk high severity alert detected
      condition: event.payload.search_name is defined
      action:
        run_workflow_template:
          organization: "Default"
          name: "Splunk Alert Enrichment Workflow"
          extra_vars:
            alert_name: "{{ event.payload.search_name }}"
            affected_host: "{{ event.payload.result.host }}"
            raw_event: "{{ event.payload.result._raw }}"
            results_link: "{{ event.payload.results_link }}"
The rulebook extracts key fields from the Splunk webhook payload and passes them as extra variables to the enrichment workflow.
Filtering by severity or search name.
In production, add more specific conditions to avoid triggering automation on every Splunk alert. Filter by search name patterns, severity fields, or custom fields.
B3. Enrichment Workflow – Gather Context and Analyze with AI
Operational Impact: Low
Once EDA triggers the enrichment workflow, Ansible gathers additional context from the affected host and sends everything to Red Hat AI for root cause analysis.
Gather additional context from the affected host:
- name: Gather host context for Splunk alert
  hosts: "{{ affected_host }}"
  become: true
  tasks:
    - name: Get systemd service status
      ansible.builtin.command:
        cmd: "systemctl status {{ service_name | default('httpd') }}"
      register: service_status
      ignore_errors: true

    - name: Collect recent journal logs
      ansible.builtin.command:
        cmd: "journalctl -u {{ service_name | default('httpd') }} --since '1 hour ago' --no-pager"
      register: journal_logs

    - name: Gather system facts
      ansible.builtin.setup:
        filter:
          - ansible_memtotal_mb
          - ansible_processor_vcpus
          - ansible_distribution*
Analyze with Red Hat AI:
- name: Analyze Splunk alert with Red Hat AI
  hosts: localhost
  tasks:
    - name: Build diagnostic prompt from host data and Splunk alert
      ansible.builtin.set_fact:
        enriched_prompt: |
          A Splunk alert fired: {{ alert_name }}
          Affected host: {{ affected_host }}
          Raw event: {{ raw_event }}
          Service status: {{ hostvars[affected_host].service_status.stdout }}
          Recent logs: {{ hostvars[affected_host].journal_logs.stdout | truncate(2000) }}

          Diagnose the root cause and recommend a remediation step.

    - name: Send diagnostics to Red Hat AI for root cause analysis
      redhat.ai.completion:
        base_url: "http://{{ rhelai_server }}:{{ rhelai_port }}"
        token: "{{ rhelai_token }}"
        prompt: "{{ enriched_prompt }}"
        model_path: "/root/.cache/instructlab/models/granite-8b-lab-v1"
      delegate_to: localhost
      register: ai_response
B4. Notify and Remediate
Operational Impact: Low (notification) -> High (remediation execution)
The enrichment workflow posts the AI analysis to your team’s communication channel and – depending on your maturity level – either queues a remediation playbook for human approval or executes it automatically.
    - name: Create enriched incident in ServiceNow with AI diagnosis
      servicenow.itsm.incident:
        state: new
        short_description: "Service Alert -- {{ alert_name }} -- {{ affected_host }}"
        description: |
          Splunk alert: {{ alert_name }}
          Host: {{ affected_host }}

          AI Root Cause Analysis:
          {{ ai_response.choice_0_text }}

          Diagnostics collected automatically -- see work notes for service status and logs.
        urgency: high
        impact: high
        caller: "ansible-automation"

    - name: Notify operations channel with diagnosis
      ansible.builtin.uri:
        url: "{{ slack_webhook_url }}"
        method: POST
        body_format: json
        body:
          text: |
            *Splunk Alert:* {{ alert_name }}
            *Host:* {{ affected_host }}
            *AI Diagnosis:* {{ ai_response.choice_0_text }}
            *Splunk Results:* {{ results_link }}

    - name: Attach AI analysis to Splunk notable event
      ansible.builtin.uri:
        url: "https://{{ splunk_server }}:8089/services/notable_update"
        method: POST
        user: "{{ splunk_user }}"
        password: "{{ splunk_password }}"
        force_basic_auth: true
        validate_certs: false
        body_format: form-urlencoded
        body:
          ruleUIDs: "{{ event_id }}"
          comment: "AI Analysis: {{ ai_response.choice_0_text }}"
          status: "2"
          urgency: "high"
Closing the loop back to Splunk.
Updating the Splunk notable event with the AI analysis creates a full audit trail – the detection, diagnosis, and remediation are all visible in Splunk’s incident review dashboard.
From here, the remediation follows the same pattern as the AIOps Remediation Workflow – Lightspeed generates a playbook, it gets committed to Git, and a Job Template is created for execution.
Use Case C: Network AIOps – OSPF Remediation
This use case demonstrates the Splunk-to-EDA pipeline for network infrastructure, using Cisco OSPF neighbor failure detection as the trigger. It adds AI-driven ticket enrichment and uses Ansible Lightspeed to generate remediation playbooks with a human approval gate.
The complete source code for this use case is available at ansible-tmm/aiops-summitlab.
C1. Configure Splunk for Network Event Detection
Operational Impact: None
Cisco IOS devices send syslog messages when OSPF neighbor adjacencies change state. Splunk ingests these syslogs, and a saved search triggers a webhook to EDA when an OSPF neighbor goes down.
Configure a TCP data input for Cisco syslogs in Splunk (Settings -> Data Inputs -> TCP -> New Local TCP):
| Setting | Value |
|---|---|
| Port | 5514 |
| Source Type | cisco:ios |
| App Context | Cisco Networks (cisco:ios) |
| Host | IP |
Create a Splunk saved search and alert after verifying OSPF events appear in Splunk’s Cisco Networks App -> Routing Dashboard:
| Setting | Value |
|---|---|
| Search | %OSPF-5-ADJCHG: Process 1, Nbr 192.168.2.2 on Tunnel0 from FULL to DOWN |
| Title | ospf-neighbor |
| Alert type | Real-time |
| Actions | Add to Triggered Alerts, Webhook |
| Webhook URL | Event-Driven Ansible webhook endpoint |
C2. EDA Rulebook for OSPF Events
Operational Impact: None
The rulebook (ospf.yml):
---
- name: "Listen for OSPF neighbor events on a webhook"
  hosts: all

  sources:
    - name: "Webhook listener for OSPF events"
      ansible.eda.webhook:
        host: 0.0.0.0
        port: 5000

  rules:
    - name: "Process OSPF neighbor event from webhook"
      condition: event.payload.search_name == 'ospf-neighbor'
      actions:
        - debug:
            msg: |
              OSPF Webhook Received!
              Search Name: {{ event.payload.search_name }}
              Triggering workflow...

        - run_workflow_template:
            name: "Network-AIOps-Workflow"
            organization: "Default"
            job_args:
              extra_vars:
                webhook_payload: "{{ event.payload }}"
The rulebook matches specifically on search_name == 'ospf-neighbor' and launches the Network-AIOps-Workflow, passing the entire webhook payload.
C3. AI-Driven Ticket Enrichment
Operational Impact: Low
When an OSPF neighbor goes down, this enrichment step eliminates manual triage – by the time the engineer opens the ticket, it already contains the AI-analyzed root cause and a recommended fix.
Capture network diagnostics from the affected router:
- name: Collect OSPF diagnostics from affected router
  hosts: "{{ affected_router | default('cisco-rtr1') }}"
  gather_facts: false
  tasks:
    - name: Get OSPF neighbor adjacency state
      cisco.ios.ios_command:
        commands:
          - show ip ospf neighbor
      register: ospf_neighbor

    - name: Get Tunnel0 interface status and counters
      cisco.ios.ios_command:
        commands:
          - show interface Tunnel0
      register: interface_status

    - name: Get OSPF interface details -- network type, hello timer, cost
      cisco.ios.ios_command:
        commands:
          - show ip ospf interface Tunnel0
      register: ospf_interface
Analyze root cause with Red Hat AI:
- name: Analyze OSPF failure and generate root cause diagnosis
  hosts: localhost
  tasks:
    - name: Build diagnostic prompt from router output
      ansible.builtin.set_fact:
        enriched_prompt: |
          A Splunk alert detected an OSPF neighbor adjacency failure.
          Alert: {{ alert_name }}
          Router: {{ affected_router }}

          OSPF Neighbor State:
          {{ hostvars[affected_router].ospf_neighbor.stdout[0] }}

          Interface Status:
          {{ hostvars[affected_router].interface_status.stdout[0] }}

          OSPF Interface Details:
          {{ hostvars[affected_router].ospf_interface.stdout[0] }}

          Diagnose the root cause of the OSPF neighbor failure and recommend a specific remediation action.

    - name: Send diagnostics to Red Hat AI for root cause analysis
      redhat.ai.completion:
        base_url: "http://{{ rhelai_server }}:{{ rhelai_port }}"
        token: "{{ rhelai_token }}"
        prompt: "{{ enriched_prompt }}"
        model_path: "/root/.cache/instructlab/models/granite-8b-lab-v1"
      delegate_to: localhost
      register: ai_response
Create enriched ITSM ticket and update Splunk:
    - name: Create enriched incident in ServiceNow
      servicenow.itsm.incident:
        state: new
        short_description: "OSPF Neighbor Down -- {{ affected_router }} -- Tunnel0"
        description: |
          Splunk alert: {{ alert_name }}
          Router: {{ affected_router }}

          AI Root Cause Analysis:
          {{ ai_response.choice_0_text }}

          Diagnostics collected automatically -- see work notes for full output.
        urgency: high
        impact: high
        caller: "ansible-automation"
      register: snow_incident

    - name: Notify operations channel with diagnosis and ticket link
      ansible.builtin.uri:
        url: "{{ chat_webhook_url }}"
        method: POST
        body_format: json
        body:
          text: |
            *OSPF Neighbor Down -- {{ affected_router }}*
            *AI Diagnosis:* {{ ai_response.choice_0_text }}
            *Incident:* {{ snow_incident.record.number }}
            *Action:* Remediation workflow pending approval in AAP.
Why enrich before remediating?
By the time the network engineer sees the ServiceNow ticket, it already contains the AI-analyzed root cause, the collected diagnostics, and a link to the pending remediation workflow. Instead of spending 20 minutes SSH-ing into routers and running
showcommands, they can review the diagnosis and approve the fix in AAP.
C4. Network AIOps Workflow – Lightspeed Remediation
Operational Impact: Low (generation) -> High (execution)
The Network-AIOps-Workflow orchestrates the full remediation pipeline:
Create Playbook AI -> Sync Project -> Playbook-Check-Mode -> [Human Approval] -> Playbook-Run-Mode
Generate remediation playbook with Lightspeed:
---
- name: Generate OSPF remediation playbook via Lightspeed
  hosts: localhost
  gather_facts: false
  vars:
    lightspeed_prompt: |
     "Create a playbook and name it 'OSPF Fix'
     host ==  cisco-rtr1
     create a task that shows the status of Tunnel0 and register the output
     run a new task that administratively enables interface for parent interface tunnel0
     when stdout contains 'administratively down'"
Lightspeed generates the YAML playbook, which is saved to the Git repository:
    - name: Call Lightspeed API to generate remediation playbook
      ansible.builtin.uri:
        url: "https://c.ai.ansible.redhat.com/api/v0/ai/generations/"
        method: POST
        headers:
          Content-Type: "application/json"
          Authorization: "Bearer {{ lightspeed_token }}"
        body_format: json
        body:
          text: "{{ lightspeed_prompt }}"
      register: response

    - name: Save Lightspeed-generated playbook to repository
      ansible.builtin.copy:
        content: "{{ response.json.playbook | from_yaml | to_nice_yaml(sort_keys=False) }}"
        dest: "{{ repository['path'] }}/playbooks/lightspeed-response.yml"
        mode: '0644'

    - name: Commit and push generated playbook to Gitea
      ansible.scm.git_publish:
        path: "{{ repository['path'] }}"
        user:
          name: lab-user
          email: lab-user@example.org
      delegate_to: localhost
The workflow then runs the generated playbook in check mode first, pauses at a human approval gate, and only applies the fix after the operator approves.
C5. Validation – Three OSPF Failure Scenarios
Each scenario demonstrates a progressively more complex OSPF failure, requiring a more detailed Lightspeed prompt:
Scenario 1: Interface Shutdown
| Details | |
|---|---|
| Trigger | config t -> int tu 0 -> shut |
| AI Diagnosis | “Tunnel0 is administratively down” |
| Lightspeed Fix | Check interface status; if administratively down, run no shutdown |
| Verification | show ip ospf neighbor shows FULL state |
Scenario 2: Incorrect OSPF Network Type
| Details | |
|---|---|
| Trigger | config t -> int tu 0 -> ip ospf network non-broadcast |
| AI Diagnosis | “OSPF network type mismatch – configured as non-broadcast, expected point-to-point” |
| Lightspeed Fix | Check interface is up; check OSPF network type; if not POINT_TO_POINT, reconfigure |
| Verification | show ip ospf int tu0 shows Network Type POINT_TO_POINT |
Scenario 3: Hello Timer Mismatch
| Details | |
|---|---|
| Trigger | config t -> int tu 0 -> ip ospf hello-interval 30 |
| AI Diagnosis | “OSPF hello timer mismatch – configured as 30s, peer expects 10s” |
| Lightspeed Fix | Check interface, network type, and hello timer; if not Hello 10, reconfigure |
| Verification | show ip ospf int tu0 shows Hello 10 |
Progressive prompt complexity.
Each scenario adds conditions to the Lightspeed prompt. Scenario 1 has one condition, Scenario 2 has two, and Scenario 3 has three. This demonstrates how a network engineer can iteratively refine their prompt to handle more failure modes in a single playbook.
Validation
Use Case A (ITSI)
| Stage | What to Verify | Success Indicator |
|---|---|---|
| 1. MLTK Detection | Correlation search fires when KPI anomaly occurs | itsi_tracked_alerts contains a Critical notable event with “MLTK Alert” title |
| 2. Episode Creation | Aggregation policy groups the notable event into an episode | Episode Review shows a new Critical episode |
| 3. EDA Trigger | Webhook reaches EDA and rulebook matches | AAP shows rulebook activation with a matched event |
| 4. Remediation | Playbook executes and closes the loop | Episode shows comment and status Closed; service returns to green |
Use Cases B and C (Webhook Alerts)
| Stage | What to Verify | Success Indicator |
|---|---|---|
| 1. Splunk Alert -> EDA | Webhook fires and EDA receives the event | AAP shows the rulebook activation as Running |
| 2. Enrichment Workflow | AI analyzed the alert and notifications were sent | Workflow Visualizer shows all nodes green; Slack/ITSM received the AI diagnosis |
| 3. Remediation Workflow | Playbook was generated and committed (network) or service was restarted (RHEL) | New playbook file exists in the Git repository |
| 4. Execute Remediation | The fix was applied | Service returns to steady state; OSPF neighbor shows FULL adjacency |
Quick validation test – Send a test webhook to EDA to simulate a Splunk alert:
# Test RHEL use case
curl -H "Content-Type: application/json" \
  -d '{
    "search_name": "Test High CPU Alert",
    "result": {
      "host": "web01.prod.internal",
      "sourcetype": "cpu_metrics",
      "cpu_percent": "95",
      "_raw": "host=web01 cpu_percent=95 process=java"
    },
    "results_link": "https://<splunk-host>/app/search/test"
  }' \
  https://<eda-controller-host>:5000/endpoint

# Test Network use case
curl -H "Content-Type: application/json" \
  -d '{
    "search_name": "ospf-neighbor",
    "result": {
      "host": "cisco-rtr1",
      "sourcetype": "cisco:ios",
      "_raw": "%OSPF-5-ADJCHG: Process 1, Nbr 192.168.2.2 on Tunnel0 from FULL to DOWN"
    },
    "results_link": "https://<splunk-host>/app/search/test"
  }' \
  https://<eda-controller-host>:5000/endpoint
Troubleshooting
| Symptom | Likely Cause | Fix |
|---|---|---|
Ansible Episode Action (ITSI) not in dropdown |
Episode action not registered in ITSI | Add [ansible_itsi] with disabled = 0 to SA-ITOA/local/notable_event_actions.conf and restart Splunk |
| R² collapses / sawtooth chart in MLTK | Duplicate data points at same timestamp | Add stats max(alert_value) as alert_value by _time, kpi between table and xyseries |
| Correlation search returns 0 results | KPI data not present or field names don’t match | Run the base SPL manually; verify service ID, KPI name, and is_service_max_severity_event |
| Notable events but no episode | Aggregation policy source filter mismatch |
The source must match the correlation search name exactly (case-sensitive) |
| Episode created but action rule doesn’t fire | Wrong trigger type | Use “the following event occurs”, not “the episode severity is” |
| Splunk alert fires but EDA doesn’t trigger | Webhook URL wrong or EDA port blocked | Verify the EDA webhook endpoint is reachable from the Splunk server |
| EDA receives event but condition doesn’t match | Payload structure doesn’t match rulebook condition | Use debug action to print event.payload and compare against conditions |
EDA matches but search_name is wrong |
Splunk alert title doesn’t match condition | Ensure titles match exactly – matching is case-sensitive |
| Enrichment workflow runs but AI response is empty | Prompt too vague or AI endpoint unreachable | Verify the Red Hat AI server is running; test with a simple prompt first |
| Network diagnostics fail | SSH/NETCONF credentials missing or router unreachable | Verify Cisco IOS credential in AAP; test with ansible -m ping |
| Lightspeed playbook doesn’t fix the issue | AI prompt doesn’t cover the failure scenario | Extend the Lightspeed prompt to include additional conditional checks |
| Webhook not reaching EDA (ITSI) | Add-on environment URL misconfigured | Check index=_internal sourcetype="ansible:alert" for delivery logs |
Maturity Path
| Maturity | ITSI Track (Use Case A) | RHEL Track (Use Case B) | Network Track (Use Case C) |
|---|---|---|---|
| Static KPI thresholds -> episodes -> engineer investigates | Splunk alert -> EDA -> AI diagnoses -> enriched context to Slack/ITSM -> human remediates | Splunk detects OSPF failure -> EDA triggers -> AI enriches -> human reviews and acts | |
| MLTK Kalman Filter forecast -> EDA triggers -> playbook remediates with human oversight | AI selects a pre-approved playbook -> human approves -> playbook executes | AI generates playbook -> check mode validates -> human approves -> playbook executes | |
| MLTK + adaptive thresholds + AI diagnosis -> fully automated closed-loop | Lightspeed generates remediation -> policy engine validates -> auto-executes | Multi-condition Lightspeed playbook -> policy engine validates -> auto-executes |
Start with Crawl.
Deploy the EDA rulebook and enrichment workflow first. Let your team see AI-enriched Splunk alerts in Slack for a few weeks before adding automated remediation. This builds confidence in the AI analysis and catches edge cases early.
Related Guides
 AIOps reference architecture: See AIOps automation with Ansible for the full end-to-end pipeline, including AI inference, Lightspeed playbook generation, and the broader AIOps maturity journey.
- Need to deploy the AI backend? See AI Infrastructure automation with Ansible for automating Red Hat AI provisioning with the
infra.aiandredhat.aicollections. - New to Event-Driven Ansible? See Get started with EDA (Ansible Rulebook) for the fundamentals of rulebooks, event sources, and actions.
 Looking for ServiceNow integration? See Unlock AIOps with ServiceNow LEAP and Ansible MCP server for LEAP/MCP-driven remediation and related ITSM patterns (see also KB 7127603).
- Want to try this hands-on? The Hands-On AIOps Workshop – Part 2 walks through Splunk integration with Cisco router remediation in a live lab.
Summary
This guide demonstrates three ways to connect Splunk to Event-Driven Ansible for closed-loop AIOps:
- Use Case A uses Splunk ITSI’s service-centric monitoring and MLTK’s Kalman Filter to predict anomalies before they impact customers, then remediates and closes the ITSI episode automatically – all through the Red Hat EDA Add-on for Splunk.
- Use Case B connects standard Splunk webhook alerts to EDA for RHEL server remediation, using Red Hat AI to diagnose the root cause and enrich ITSM tickets before fixing the issue.
- Use Case C detects Cisco OSPF neighbor failures via Splunk, enriches the incident with AI-driven diagnostics, and uses Ansible Lightspeed to generate remediation playbooks with check-mode validation and human approval gates.
The same pipeline applies across all three: Splunk detects, EDA triggers, AI enriches, and Ansible remediates – reducing MTTR from hours of manual investigation to minutes of automated resolution. Whether the alert is a predicted network throughput anomaly, a failed httpd service, or an OSPF adjacency down, the pattern is the same. Only the detection logic, diagnostics collection, and remediation tasks change.
Next Steps
| Try Ansible Automation Platform | Start a free 60-day trial and build your first automation workflows |
| Red Hat Consulting | Work with Red Hat experts to design, implement, and scale AIOps automation tailored to your environment |
| Training and Certification | Build team skills with hands-on courses and industry-recognized certifications |
![]()